
A Guide to Using Performator with Core Banking T24
- Josef Mayrhofer

- 12 minutes ago
- 2 min read
As we’ve seen in previous posts, Performator is a powerful tool that allows us to measure the performance of our core banking system in a highly customizable way.
In this post, we’ll walk through a simple, practical example of how to use Performator in a T24 environment.
Requirements:
A Quickstart version of Performator (in our case, version 1.2.2)

Access to a T24 service (in our case, a SOAP service to execute third-party account transactions)

Internet access to download dependencies using Maven
Getting Started: Creating Our Script
The first step is to create our script, which follows a structure already defined by Performator:
initializeUser method
Used to load parameters or values needed in the script. In our case, we define logging behavior and pause settings specific to Performator.

execute method
This is where the script's main logic resides. Essentially, it contains the call to the service whose performance we want to measure.

terminate method
Used for final steps such as closing files or writing logs.
For simplicity, we won’t include logic here in this example.
Creating the Test Class
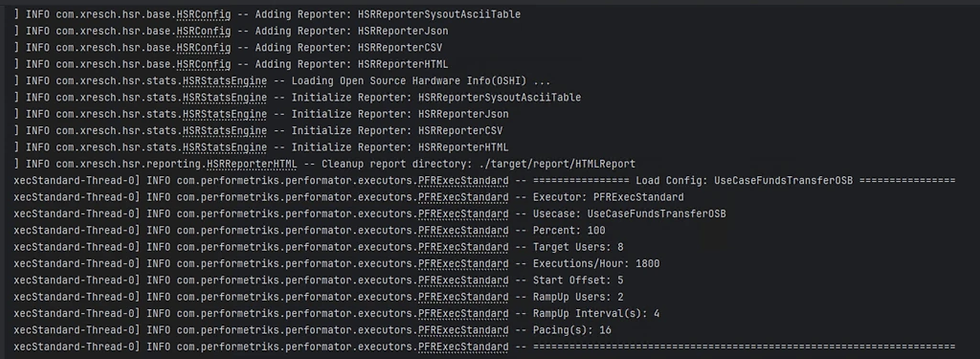
Next, we create our test class, where we define how the load will be injected:
Number of users
Execution time
Initial delay before starting
Ramp-up time (time to reach full load)

Once this is set, we can compile and execute the test.
Results and Reports
The results can be found in the following path:
target/report/HTMLReportPerformator can also be configured to store results in a database for further analysis.
Dashboard Insights
The report includes a dashboard with key metrics such as:
Hardware performance behavior

Number of executed operations
Response times
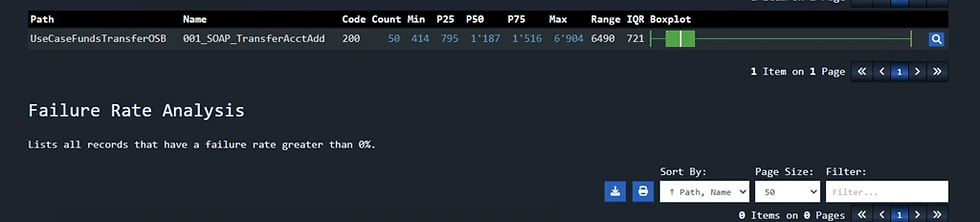
In this case, all operations were successful.
Performance Analysis
We observed a maximum response time of 1.8 seconds for our transactions.
But what if we want to be more demanding?
We can define an SLA rule in our script, for example:
99% of transactions must have a response time below 2 seconds
This is achieved in two steps:
Defining the SLA metric

Applying it to the transaction service call

After running the test again, we can confirm in the report that the SLA was successfully met.

Conclusion
Our environment shows efficient response times under the tested load.
From here, we can gradually increase the load to:
Stress the system
Identify the breaking point
This is valuable information for defining strategies and ensuring our core banking system is ready for modern processing demands.
There are many more ways to use Performator for: Load injection, transaction simulation, and advanced performance metrics. Now, if you’d like to learn more about this tool, feel free to reach out. At Perfometriks, we’re ready to support you in your technology journey.
Happy Performance Engineering!


Comments