
Comparison of Free Open Source L&P Frameworks: Gatling, K6, and Performator
- Josef Mayrhofer

- Feb 12
- 21 min read
Updated: Apr 8
The requirements for load and performance testing tools are ever-increasing with the growing complexity of today's IT systems. There are various free open-source tools available, but are they up to the challenges they need to tackle?
Choosing the right framework for your needs is not an easy task, especially when you are not professionally working in performance engineering. This post will compare free, open-source L&P testing frameworks such as K6, Gatling, and our in-house multi-talent Performator, built to incorporate all the features that we missed in the other tools.
The enterprise offerings are out of scope for this comparison, and for most of the evaluation, we will focus on the HTTP capabilities offered by all three frameworks.
If you want to try Performator, feel free to consider the Quickstart project and have a look for yourself:
You can run a test with the following command(results will be in ./target/report):
mvn clean verify -Dpfr_test=com.performetriks.performator.quickstart.tests.PFRTestExampleThe HttpConverter can be started with:
mvn clean verify -Dpfr_mode=httpconverterOverview
Overview of the feature comparison.
Key | K6 Open Source | Gatling Open Source | Performator Open Source |
Coding Language | Javascript | Scala(its native language) Java, Kotlin, JavaScript, TypeScript. | Java |
Technologies | HTTP, Browser, and many other things you can execute in JavaScript | HTTP, WebSockets, JMS, etc. | Anything you can execute in Java |
Reporting | - Raw metrics, many you don’t need 99% of the time - Built-In CSV and JSON - Various features to report to various data sources - No aggregated metrics - No HTML report without extension | - Static HTML Report - No other outputs (removed from open source version in 2024) | - Aggregated metrics - Optional raw metrics to file - Extendable Reporting Engine, included reporters: CSV, JSON, Database, HTML Report, OpenTelemetry, and various command line outputs |
Summary Reports | ✅ Yes | ✅ Yes | ✅ Yes |
Data Storage | ✅ Various Data Sources | ❌ No, HTML only | ✅ Database, OTel, or Custom |
Data Storage: Age Out of Data | ✅ Yes, depends on data source | ❌ No, HTML only | ✅ Yes, for database |
Data on Test Interruption | ✅ Yes | ❌ No, Report only at test end | ✅ Yes |
Real Time Monitoring | ✅ Yes | ❌ No, Report only at test end | ✅ Yes |
Real Time Analysis Dashboard | ✅ Yes, Grafana Templates | ❌ No, HTML Only | ✅ Yes, EMP Templates |
HTTP Response Validation | ✅ Yes | ✅ Yes | ✅ Yes |
Validation marks request as failed/success | ❌ No | ✅ Yes | ✅ Yes |
Separated reporting of failed requests | ❌ No | ✅ Yes | ✅ Yes |
Reporting custom metrics | ⚠️ Yes, but cumbersome | ❌ No | ✅ Yes, various types |
Naming HTTP Requests | ⚠️ Yes, slightly cumbersome | ✅ Yes | ✅ Yes |
Grouping of Metrics | ✅ Yes | ✅ Yes | ✅ Yes |
Loading of Testdata Files | ✅ Yes | ✅ Yes | ✅ Yes |
Using Testdata | ✅ JSON, variable types | ⚠️ Internal Storage with variable placeholders, can become cumbersome for using objects and arrays. | ✅ Data Records, variable types |
Extracting Values from Response | ✅ Yes, use any JavaScript code | ⚠️ Yes, not intuitive | ✅ Yes, use any Java code |
Converting HAR Files | Yes | ✅ Yes | ✅ Yes |
Converting Postman Collections | ✅ Yes | ❌ Enterprise Only | ✅ Yes |
Post-processing of generated scripts | ❌ No | ❌ No | ✅ Yes, JavaScript-based |
Separation of Use Cases and Load Scenarios | ⚠️ Yes, slightly cumbersome | ✅ Yes | ✅ Yes |
Standard Load Calculation | ⚠️ Partially | ❌ No | ✅ Yes |
Reduce Load using Percentage | ⚠️ Manual Calculation | ⚠️ Manual Calculation | ✅ Built-in Calculation |
Distributed Load Testing | ⚠️ Yes, limited | ❌ No | ✅ Yes, Agent-based |
Filtering Agents by Tags | ❌ No | ❌ No | ✅ Yes |
SLA Evaluation | ⚠️ Yes, decoupled from metrics | ⚠️ Yes, decoupled from metrics | ✅ Yes, together with metrics |
SLA Evaluation over Time | ❌ No | ❌ No | ✅ Yes |
Exception Message Statistics | ❌ No | ✅ Yes | ✅ Yes |
Stacktrace Statistics | ❌ No | ❌ No | ✅ Yes |
Debug Logs (Failing Request only?) | ❌ Manual logs only | ⚠️ Yes, all requests or manually | ✅ Yes, all or failing requests, manual logs |
Debug Logs: Enhanced Readability | ❌ No | ❌ No | ✅ Yes |
Graceful Stop | ✅ Yes, on usecases | ⚠️ Manual setup | ✅ Yes, on tests and usecases |
System Usage Metrics of Controller Machine | ❌ No | ❌ No | ✅ Yes |
Configure HTTP Timeout | ⚠️ On request only | ✅ global and per request | ✅ Global, per usecase and request |
Random Pauses | ⚠️ Self-implementation | ✅ Per request | ✅ Global, per usecase and request |
Global Disabling of Pauses | ⚠️ Self-implementation | ✅ Global | ✅ Global, per usecase and request |
Pauses excluded from Measurements | ❌ No | ✅ Yes | ✅ Yes |
Report Custom Properties | ⚠️ With a workaround | ⚠️ Command-line args only | ✅ Yes |
Report Test Settings (users, exec/h … ) | ❌ No | ❌ No | ✅ Yes |
Report Custom Messages | ❌ No | ❌ No | ✅ Yes |
Extendable Reporting | ✅ Yes | ❌ No | ✅ Yes |
Compared Analysis | ❌ Cloud only | ❌ No, HTML Only | ✅ Yes, EMP Templates |
Boxplot Analysis | ❌ No | ❌ No | ✅ Yes |
Filtering Metrics in Reports | ⚠️ Only through a Dashboard | ❌ No, HTML Only | ✅ Yes, Built-in in HTML Report |
Exporting CSV Data from Report | ✅ No report, but data available | ❌ No, HTML Only | ✅ Exporting from HTML Report |
General
K6 is a JavaScript-based load testing tool provided by Grafana and, therefore, also integrates into their landscape. Tests are executed by a small k6 executable that has to be installed.
Gatling is a Scala-based solution, where you write your tests in either Scala, Java, JavaScript, TypeScript, or Kotlin. You have a development project, and the test can be executed with a build tool like Maven.
Performator is a Java-based, extendable framework that has a flexible and extendable reporting engine. You can measure anything you can execute in Java.
Reporting
K6 - Very Detailed - But Cluttered: Reports a lot of raw metrics and a summary report at the end of the test. It offers a built-in dashboard that can be enabled to view basic real-time graphs locally, but this feature is only accessible during the test. There is no HTML report at the end of the test (without extensions), and any file output options are raw metrics. The collected metrics must be sent to a timeseries solution like TimescaleDB, influxDB or such, so that they can be usefully analyzed in a dashboarding tool like Grafana. The alternative to using extensions is to output the raw data to a CSV file, which then could be analyzed in Excel. The CSV output will contain about 1KB of data for every simple request. If you have a test with 100’000 HTTP-Requests, you will end up with a 100MB csv file
The following shows the CSV output for a single request, which is part of a group “MyTestCase“:
metric_name,timestamp,metric_value,check,error,error_code,expected_response,group,method,name,proto,scenario,service,status,subproto,tls_version,url,extra_tags,metadata http_reqs,1750768857,1.000000,,,,true,::MyTestCase,GET,https://test.k6.io,HTTP/2.0,default,,302,,tls1.3,https://test.k6.io,, http_req_duration,1750768857,25.793100,,,,true,::MyTestCase,GET,https://test.k6.io,HTTP/2.0,default,,302,,tls1.3,https://test.k6.io,, http_req_blocked,1750768857,113.983400,,,,true,::MyTestCase,GET,https://test.k6.io,HTTP/2.0,default,,302,,tls1.3,https://test.k6.io,, http_req_connecting,1750768857,6.705700,,,,true,::MyTestCase,GET,https://test.k6.io,HTTP/2.0,default,,302,,tls1.3,https://test.k6.io,, http_req_tls_handshaking,1750768857,83.259300,,,,true,::MyTestCase,GET,https://test.k6.io,HTTP/2.0,default,,302,,tls1.3,https://test.k6.io,, http_req_sending,1750768857,0.422400,,,,true,::MyTestCase,GET,https://test.k6.io,HTTP/2.0,default,,302,,tls1.3,https://test.k6.io,, http_req_waiting,1750768857,25.370700,,,,true,::MyTestCase,GET,https://test.k6.io,HTTP/2.0,default,,302,,tls1.3,https://test.k6.io,, http_req_receiving,1750768857,0.000000,,,,true,::MyTestCase,GET,https://test.k6.io,HTTP/2.0,default,,302,,tls1.3,https://test.k6.io,, http_req_failed,1750768857,0.000000,,,,true,::MyTestCase,GET,https://test.k6.io,HTTP/2.0,default,,302,,tls1.3,https://test.k6.io,,Gatling - Static HTML Only: Aggregates and reports metrics in a static HTML report with tables at the end of a test. This is the only way to get your data in the open-source version.

Performator - Flexible Reporting of Aggregated Metrics: Performator allows you to add reporters to your test and also create your own reporters.
// Built-in Sysout Reporters: HSRReporterSysoutAsciiTable, HSRReporterSysoutCSV, HSRReporterSysoutJson
HSRConfig.addReporter(new HSRReporterSysoutAsciiTable(75));

// Built-in File Reporters: HSRReporterCSV / HSRReporterJson / HSRReporterHTML
HSRConfig.addReporter(new HSRReporterCSV( DIR_RESULTS + "/hsr-stats.csv", ",") );
HSRConfig.addReporter(new HSRReporterHTML( DIR_RESULTS + "/HTMLReport") );

// Database Reporters
HSRConfig.addReporter( new HSRReporterDatabasePostGres(
        "localhost"
        , 5432
        , "postgres"	// dbname
        , "hsr"		// table name prefix
        , "postgres"	// user
        , "postgres"	// pw
));
The built-in HTML report will be written at the end of the test, giving you a nice summary report that includes many tables and charts. For every metric in your test, you can view detailed charts and export the raw data.


HTTP Response Validation
K6 provides a simple function that can be used to execute checks. Checks are entirely separate from your requests and cannot influence whether a request is considered failed or successful. The checks in K6 are counters that can be used with thresholds to determine whether a test is considered successful or failed.
import { check } from 'k6';
export default function () {
    let res = http.get('https://test.k6.io');
    check(res, {
        'status is 200': (r) => r.status === 200,
    });
}
Gatling provides a check() function that allows validating HTTP response codes, headers, and body. This influences whether a request is considered successful or failing. One downside is that it is not intuitive what parameters you can provide to the check method. You have to know that “status().is(200)“ can be placed inside the check()-method.
http("Gatling")
  .get("https://gatling.io")
  .check(status().is(200))
Performator provides various check() functions that allow validating HTTP response codes, headers, and body. This influences whether a request is considered successful or failing. The check functions can easily be listed using the content assist function of your IDE, which makes it intuitive without the need to check in the documentation how the validation is done. The following are a few examples of the methods you can use in an HTTP request.
PFRHttp.create("000_My_Example_Metric_Name", url+"/app/example?id=")
	.checkStatusEquals(200)
	.checkBodyContains("Sign In")
	.checkBodyRegex("\"payload\"")
	.checkHeaderContains("Content-Encoding", "Sign In")
	.checkHeaderEquals("Cache-Control", "no-cache")
	.checkHeaderRegex("Content-Type", "application/.*")
	.check(new PFRHttpCheck(new PFRHttpCheckCustom() {
            @Override
            public boolean check(PFRHttpCheck check, PFRHttpResponse r) {
                check.messageOnFail("Body was smaller than 1KB.");
                return r.getBodySize() >= 1024;
            }
        })
    );
Separation of Failed Requests
This is a crucial feature in load testing tools, as failing requests can severely distort your measured response times in both directions (lower times for aborted requests, higher times for running into timeouts).
In K6, there doesn’t seem to be a way to separate metrics of failed requests based on response validation.
Gatling reports metrics for successful and failed requests separately as OK, KO, and ALL values.
Performator reports metrics for successful and failed requests separately as OK and NOK values.
Custom Metrics
Gatling open source does not allow reporting of custom metrics.
K6 allows the creation of custom metrics using objects as follows:
import { Trend } from 'k6/metrics';

var myCustomMetric = new Trend('myCustomMetric');
var myCustomTime = new Trend('myCustomTime');
function customMetric() {

	let start = Date.now();
		let res = http.get('https://test.k6.io');
	let end = Date.now();

	myCustomMetric.add(res.timings.duration);
	myCustomTime.add(end-start);

	sleep(1);
}
The downside of how K6 does this is that you cannot declare your metric where you actually use it, which can make it quite cumbersome to declare and manage metrics, especially when you have a lot of them. For example, the following cannot be done in K6:
function customMetric() {

    //-------------------------
    // First Request
	var firstMetric = new Trend('firstMetric');
		let res = http.get('https://test.k6.io');
	firstMetric.add(res.timings.duration);

    //-------------------------
    // Second Request
	var secondMetric = new Trend('secondMetric');
		let res = http.get('https://test.k6.io');
	secondMetric.add(res.timings.duration);

}
If you try the above, you will wind up with one of the following errors:
ERRO[0029] GoError: metrics must be declared in the init context
running at customMetric (file:///Z:/Repositories/PENG_Toolbox/K6/k6_script.js:49:23(3))
default at file:///Z:/Repositories/PENG_Toolbox/K6/k6_script.js:26:16(7)
        at go.k6.io/k6/js/modules/k6.(*K6).Group-fm (native)

ERRO[0000] invalid threshold defined on myCustomMetric; reason: no metric name "myCustomMetric" found
Therefore, the method above is not really recommended. A superior approach for response time metrics is to use groups, as shown later in this post.
Performator allows reporting of various custom metrics: Step, Group, User, Metric, Count, Gauge, System, Assert, Wait, Exception, MessageInfo, MessageWarn, MessageError, and Unknown. Following a few examples on how to register metrics in the underlying statistics engine HieraStatsReport(HSR):
// ------ Metrics ------
HSR.addGauge("070.1 Gauge: SessionCount", new BigDecimal(80));
HSR.addCount("070.2 Count: TiramisusEaten", new BigDecimal(42));
HSR.addMetric("070.3 Metric: TimeWalked", new BigDecimal(300));

// ------ Step ------
HSR.start("010_MyMetricName");
	//Code to measure
HSR.end();

// ------ Messages ------
HSR.addErrorMessage("The train has been cancelled.");
HSR.addException(new Exception("This is an exception."));
HSR.addAssert("MyAssertMessage", isSuccess);
Naming of HTTP Requests
Naming requests is useful for making it easier to understand what the script is doing, and it can be used to get requests sorted in the reports by the order they occur, by using numbers as a prefix.
K6 allows custom naming of requests using tags (default name is the URL), the syntax to do so is, however, rather cumbersome for such a simple action. The names will not appear in the summary report; they will only be reported to output destinations(files, time series databases …).
function namedRequest() {
    let res = http.get('https://test.k6.io', { tags: { name: 'My Request Name' } } );
    sleep(1);
}
Gatling allows you to name the requests right when you create them:
http("RequestDessert").get("http://www.example.test/gimmeTiramisu");Performator allows you to name the requests right when you create them:
PFRHttp.create("010_Order_Tiramisu", "http://www.tiramisu.com/order?amount=42");Grouping of Metrics
K6 allows grouping of metrics using the group method. This will group metrics in the summary output to be reported for each group and subgroup. However, the volume of reported metrics for each group might make the report rather big and difficult to read:
import { group } from 'k6';

//#####################################################
// Default
//#####################################################
export default function () {
	group('MyTestCase', function () {

        let res = http.get('https://test.k6.io');

		group('Subgroup', function () {
			let res2 = http.get('https://test.k6.io');
		});
	});
}
Gatling allows you to easily create custom counts and response time metrics using groups and naming your requests:
group("My Test").on(
    group("Subgroup").on(
        exec(
            http("fetchInfo").get("http://www.example.test/gimmeTiramisu")
        )
        , http("testError").get("https://does.not.exist/fails")
    )
Performator allows you to group requests using its underlying stats engine HieraStatsReport(HSR):
HSR.startGroup("017_MyGroup");
	PFRHttp.create("010_Order_Tiramisu", "http://www.tiramisu.com/order?amount=42").send();
	PFRHttp.create("020_Rate_Tiramisu", "http://www.tiramisu.com/rate?stars=5of5").send();
HSR.end();
Test Data Files and Data Usage
Test data files are used to make load tests more realistic and test different data constellations. In most cases, you will receive CSV files as database exports from the project you are testing. All tools support using CSV and JSON files and custom data sources.
K6 does not support CSV natively and needs an additional library like Papa Parse to do so. Following is an example of how to read and use data from a CSV file in K6:
import http from 'k6/http';
import { SharedArray } from 'k6/data';
import papaparse from 'https://jslib.k6.io/papaparse/5.1.1/index.js';

//##############################
// Load CSV File with columns "username,password"
const csvData = new SharedArray('myData', function () {
  return papaparse.parse(open('./users.csv'), { header: true }).data;
});

//##############################
// Default Function
export default function () {

  const randomUser = csvData[Math.floor(Math.random() * csvData.length)];

  const params = {
    login: randomUser.username,
    password: randomUser.password,
  };

  const res = http.post('https://test.k6.io/login.php', params);

  sleep(1);
}
Gatling is a bit simpler, having simple methods to iterate data in various ways and substitute string placeholders like “#{paramName}” with the data from the file. Basic CSV data is no issue, but when you want to use arrays and objects, Gatling can become cumbersome.
feeder = csv("data.csv").queue(); // default behavior: use an Iterator on the underlying sequence
feeder = csv("data.csv").random(); // randomly pick an entry in the sequence
feeder = csv("data.csv").shuffle(); // shuffle entries, then behave like queue
feeder = csv("data.csv").circular(); // go back to the top of the sequence once the end is reached

//-----------------------
// Using the data with #{paramName}
myScenario
  .feed(feeder)
  .exec(
      http("Load Data")
          .get("/api/v1/data?name=#{name}&dessert=#{dessert}")
  )
Performator loads test data files from Java packages. You can load your custom data as a JSON array or create your custom data loader. You can access a record and use any of its attributes however you like, using String concatenation, String formatting, or passing the values to methods.
//=======================================
// Load Testdata
DATA = PFR.Data.newSourceCSV("mainData", "com.mycompany.data", "testdata.csv", ",")
		.accessMode(AccessMode.SEQUENTIAL)  // SEQUENTIAL, SHUFFLE or RANDOM
  		.retainMode(RetainMode.INFINITE)    // INFINITE or ONCE
		.build();
;

//=======================================
// Get Testdata
PFRDataRecord record = DATA.next();

int id 			= record.get("ID").getAsInteger();
String username 	= record.get("USER").getAsString();
boolean tiramisu	= record.get("LIKES_TIRAMISU").getAsBoolean();
JsonObject object	= record.get("ADDRESS").getAsJsonObject();
JsonArray tags		= record.get("TAGS").getAsJsonArray();

//=======================================
// Example Data Usage
PFRHttpResponse r = PFRHttp.create("CheckData", "https://jsonplaceholder.typicode.com/posts")
        .POST()
        .header("tags", tags.toString());
        .bodyJSON("""
            {
                  "id": %d
                , "username": "%s"
                , "tiramisu": %b
            }
            """.formatted(id, username, tiramisu)
        ).send();
Extracting Values and Using Them
K6 allows you to read values directly from a response object with any JavaScript function you prefer, and also has options to read cookies from headers as follows:
  const res = http.post('https://quickpizza.grafana.com/api/cookies?sessionID=meSessionID123');

  const jar = http.cookieJar();
  const cookiesForURL = jar.cookiesForURL(res.url);

  console.log(cookiesForURL.sessionID);
Gatling allows you to extract values from a response and save them to the session object. However, you need to know which method to use and have to stick to what Gatling provides. It is a bit unintuitive that you have to put extractions into the check()-method. The values also have to be stored in the session object in order to be used.
After extraction, the values can be retrieved from the session object:
exec(getCookieValue(CookieKey("sessionID")));Gatling also has the possibility to propagate extracted values into a shared ProtocolBuilder:
private final String ACCESS_TOKEN = "accessToken";

http("Login")
  .post("/login")
  .check(jmesPath("accessToken").saveAs(ACCESS_TOKEN));

protocolBuilder.header(
        "Authorization",
        session -> Optional.ofNullable(session.getString(ACCESS_TOKEN)).orElse(""));
Performator allows you to extract any value from the response string with any Java code you want to use for that purpose. The HTTP response object provides a method to directly get a response as a JsonObject or a JsonArray. Following an example that shows how to load data from a web URL and use it as a data record:
JsonArray userArray = response.getBodyAsJsonArray();
PFRDataSource userData = PFR.Data.newSourceJsonArray("userList", userArray).build();
PFRDataRecord record = userData.next();
Converting and Recording
To easily have a base you can start from, load testing tools often come with a way to record or generate scripts. All tools provide ways to generate their scripts.
K6: Installable Desktop Application, VSCode plugin, HAR File Converter, Postman Collection Converter
Gatling: Recorder Application(shipped with code), HAR File Converter
Performator: Converter Application (shipped with code), converts HAR files and Postman Collections, custom post-processing of scripts using JavaScript
Separation of Test Cases and Simulations
Test cases in load testing are separated into different files and should be able to be executed together, creating a simulated real-world load as closely as possible to reality.
K6 allows such separation of test cases and simulations. As in the following code, you can create files containing your scenarios, while having a main file used to define the simulation. The structure is a bit bloated and cumbersome, as for every scenario, you have to import it, create a separate method that executes the scenario, and define the execution method in the list of scenarios, as in the following code:
import { default as scenarioDashboard } from './scenarioDashboard.js';
import { default as scenarioHomepage } from './scenarioHomepage.js';

export const options: Options = {
  thresholds: {
    http_req_duration: [`p(99)<${httpReqDuration}`],
    checks: ['rate>0.80'],
  },
  scenarios: {
    scriptAuthenticatedScenario: {
      exec: 'execScenarioDashboard',  // Refers to the method to be executed
      executor: 'constant-vus',
      vus: 10,
      duration: '30s',
    },
    scriptUnauthenticatedScenario: {
      exec: 'execScenarioHomepage',  // Refers to the method to be executed
      executor: 'ramping-vus',
      stages: [
        { duration: '5s', target: 100 },
        { duration: '5s', target: 0 },
      ],
    },
  },
};

export function execScenarioDashboard() {
  scenarioDashboard(); // imported from other file
}

export function execScenarioHomepage() {
  scenarioHomepage(); // imported from other file
}
Gatling also has a concept of Scenarios and Simulations. These can be defined in the same class or in separate classes. For simplicity, here is a Simulation with a scenario:
public class ExampleSimulation extends Simulation {

  // Define HTTP configuration
  HttpProtocolBuilder httpProtocol =
    http.baseUrl("https://api-ecomm.gatling.io")
        .acceptHeader("application/json")
        .userAgentHeader(
            "Mozilla/5.0 (Macintosh; Intel Mac OS X 10_15_7) AppleWebKit/537.36 (KHTML, like Gecko) Chrome/134.0.0.0 Safari/537.36");

  // Scenario
  ScenarioBuilder scenario =
    scenario("Scenario").exec(http("Session").get("/session"));

  // Define Simulation
  {
    setUp(scenario.injectOpen(constantUsersPerSec(2).during(60))).protocols(httpProtocol);
  }
}
Performator: splits usecases and test definitions, making it easy to execute the same use case in different load scenarios.
public class PFRTestExample extends PFRTest {

	public PFRTestExample() {

		Globals.commonInitialization(true);

		int percentage = 100;

		this.add(new PFRExecStandard(UsecaseExampleHSR.class, 50, 12000, 0, 5).percent(percentage) );

		this.add(new PFRExecStandard(UsecaseExampleSLA.class)
						.users(5)
						.execsHour(2000)
						.rampUp(2)
						.offset(20)
						.percent(percentage)
					);

		this.maxDuration(Duration.ofSeconds(90));
		this.gracefulStop(Duration.ofSeconds(30));
	}
}
Standard Load Calculation
Calculating the appropriate load to be executed against your system is one of the most important factors in load testing. The most common way to create a stable and controlled load pattern is to define a pacing time. This allows us to define how often a specific scenario should be executed per time unit. In our years of load testing, we most commonly just want to be able to define the following 4 factors per scenario:
Virtual Users: The number of virtual users to simulate
Executions/hour: The total number of executions a scenario should be executed by all the VUs.
Start Offset: The time to wait from the start of the test until the scenario starts.
Users Per Ramp Up: Number of users that should be added per ramp up interval. (to control Parallelization)
What we don’t want to bother with is the Pacing Time and the RampUpInterval, which both can be calculated based on the above factors.
K6 seems not to support the above concept totally, but you can define a scenario with a number of VirtualUsers and Executions/hour, while not being in control of the ramp up of the users:
export const options = {
  scenarios: {
    myScenario: {
      executor: 'constant-arrival-rate',
      duration: '8h', 	// How long the test lasts
      rate: 3000,		// How many iterations per timeUnit
      timeUnit: '1h', 	// Start `rate` iterations per second
      preAllocatedVUs: 2,	// Pre-allocate 2 VUs before starting the test
      maxVUs: 20,		// Spin up a maximum of 50 VUs to sustain the defined rate
    },
  },
};
Gatling supports the concept of pacing, but leaves the calculation of everything else to the engineer.
scn.injectOpen(
    incrementUsersPerSec(5.0)
      .times(5)
      .eachLevelLasting(10)
      .separatedByRampsLasting(10)
      .startingFrom(10) // Double
)Performator: Uses the concept of executors to define load patterns. It also provides a method to reduce the defined load to a percentage without having to calculate it manually.
this.add(new PFRExecStandard(UsecaseExample.class)
            .users(5)
            .execsHour(2000)
            .rampUp(2)
            .offset(20)
            .percent(percentage)
        );
Distributed Load Testing
Gatling does not support distributed load testing in the Open source version.
K6 has a container-platform setup using their k6-operator, which seems a slightly bigger setup. The positive thing of this setup is that you can easily spin up as many agents as you need. The downside of it is you need another configuration file and cannot define specific agents for specific purposes from what we see in the documentation. If you only test HTTP and just need more machine power, this might not be an issue. However, when you test HTTP, simulate a browser, need to execute tests from a specific location etc… then this approach would not be sufficient.
Performator provides an agent-based approach for distributed load testing. Agents can be defined in a pool, and this pool can be filtered by custom tags. These agents can be setup on any machine you like, either physical, virtual or in a container environment.
PFRAgentPool pool = new PFRAgentPool(
          new PFRAgent("inactiveAgent", 7779 , "windows", "cloud").active(false)
        , new PFRAgent("winserver123" , 7779 , "windows", "cloud")
        , new PFRAgent("localhost"    , 7777 , "windows", "dev", "test")
        , new PFRAgent("asusstrix"    , 7778 , "windows", "dev")
        , new PFRAgent("lenovop16s"   , 7778 , "windows", "test")
    );

PFRConfig.setAgentPool(pool);
PFRConfig.setAgentTags("windows", "dev"); // filter agents that have all of these tags
SLA/SLO Evaluation
K6 uses thresholds to check if SLAs are met or not. An issue for code maintenance is that the threshold definitions are decoupled from the actual requests. For example, if you change the name of the request, you must also change the threshold definition. The SLA evaluation in the report is reported separately from everything else, which makes the analysis a bit harder:
export const options = {
  thresholds: {
     http_req_duration: ['p(90)<300', 'p(95)<500'],
     http_req_failed: ['rate<0.005'],
    'http_req_duration{name:Login}': ['p(95)<400'],
    'http_req_failed{name:Login}': ['rate<0.01'],
  },
};
Gatling provides the possibility to define SLA/SLO criteria when you set up a simulation. We also have the downside that the SLA is decoupled from the actual request definition, making code harder to maintain. You can easily define global SLAs. Here is an example of how to define such assertions:
setUp(scn.injectOpen(injectionProfile))
  .assertions(
      global().responseTime().max().lt(50)
	, forAll().successfulRequests().percent().gt(95.0)
	, details("My Test").responseTime().mean().lt(5)
  );
Another downside is how the SLA is reported separately from everything else in the HTML report:

Performator allows for registering SLA evaluation directly with the requests. It makes it possible to define global variables that can be reused on multiple requests:
private static final HSRSLA SLA_P90_AND_FAILRATE =
		new HSRSLA(HSRMetric.p90, Operator.LTE, 500) // p90 <= 500ms
			  .and(HSRMetric.failrate, Operator.LTE, 5); // failure rate <= 5%

r = PFRHttp.create("000_SLA_Example", "www.ma-spiffy-website.me")
	.sla(SLA_P90_AND_FAILRATE)				// add a reusable SLA
	.sla(HSRMetric.p90, Operator.LTE, 100)	// add an SLA directly
Performator reports SLA evaluation directly with other crucial values for every metric, as well as an evaluation of the SLA over time:

Reporting Exceptions and Stacktraces
Having an overview of exceptions and their stacktraces that occured during the test helps to debug scripts and evaluate how well the test executed.
K6 does not seem to automatically report error statistics.
Gatling includes in it’s HTML report basic exception message counts with the corresponding exception class:

Performator reports exception messages as well as counts for truncated stack traces. This helps to quickly find pain points in your scripts.

Debug Logs
Debug logs are vital to maintain scripts and figure out why certain steps fail and how to fix them.
Most tools, including K6 and Gatling, have three different debug log modes: No debug logs / Debug logs for everything / Log it yourself. This makes it rather cumbersome, as the log output gets extremely difficult to read, especially if you have to run a load test to get the actual errors and cannot just execute a single iteration.
Performator solve this by allowing to enable debug logs for failing requests only, either globally or for a specific use case. Also, it has the possibility to add log details to the debug logs.
PFRHttp.debugLogFail(true);	// log details for requests that fail
PFRHttp.debugLogAll(true); 	// log all request details

PFRContext.logDetailsAdd("user", user); // add custom details to logs, very useful to find failing test data
PFRContext.logDetailsAdd(record); // add all the fields of the data record
Performator also addressed the problem of readability and seeing where one debug log starts and ends, by surrounding the logs with a “wrench” made of hashtags:

Graceful Stopping of Tests
Adding a duration for the users to finish their current execution is called graceful stopping.
This can be crucial for certain setups, as interrupting a script in the middle of the execution might cause constellations that negatively impact further tests.
Gatling does not have a direct feature to configure a graceful stop. You would need to manually set a duration on each scenario and a little longer duration for the overall simulation.
K6 has a simple configuration for gracefully stopping a test:
export const options = {
  discardResponseBodies: true,
  scenarios: {
    contacts: {
      executor: 'constant-vus',
      vus: 100,
      duration: '10s',
      gracefulStop: '3s',
    },
  },
};
Performator allows to set a graceful stop duration both on usecases and on tests:
public class PFRTestExampleDuration extends PFRTest {

	public PFRTestExampleDuration() {

		this.add(
			new PFRExecStandard(
				UsecaseExampleHSR.class, 50, 12000, 0, 5)
					.percent(percentage)
					.maxDuration( Duration.ofSeconds(300) ) // max duration for use case
					.gracefulStop( Duration.ofSeconds(5) ) // graceful duration for use case
			);

		// The durations for the whole test
		this.maxDuration(Duration.ofSeconds(600));
		this.gracefulStop(Duration.ofSeconds(60));

	}
}
System Usage Metrics of Controller Machine
Neither K6 nor Gatling collect metrics for the machine they are executing on.
Performator collects metrics for CPU, Host Memory Usage, JVM Memory Usage (Performator Process), Disk I/O and Network I/O.

Configure Timeouts
K6 makes it possible to define response timeouts on every request separately, but not globally:
import http from 'k6/http';

export default function () {
  const params = {
    timeout: '360s'
};

const res = http.get('https://test.k6.io', params);
Gatling allows setting timeouts per request and global defaults:
http("name").get("/").requestTimeout(Duration.ofMinutes(3));Performator allows to set timeouts per request, for each usecase or globally:
PFRHttp.defaultResponseTimeout(HSRTimeUnit.s.toMillis(60)); // set default HTTP timeout to 60 seconds
PFRHttp.create("666_DisastrousURL", url+"/no-tiramisu").timeout(6000);
Random Pauses
Adding random pause times between requests allows for a more natural distribution of load while keeping the pacing of a use case.
K6 does not have a built-in random pause time function, meaning you have to create your own. Also, pause times will be included in group measurements. There is no global configuration to add a default pause after each request.
import http from 'k6/http';
import { sleep } from 'k6';

function randomSleep(min, max) {
  sleep(Math.random() * (max - min) + min);
}

randomSleep(1, 3); // sleep between 1 and 3 seconds
Gatling allows for refining random pauses in requests and disabling all pauses globally. Also, pause times will be excluded from group measurements. There is no global configuration to add a default pause after each request. However, Gatling has various settings in the setUp()-Builder chain to adapt defined pause times.
.pause(100, 200); // random pause 100 to 200 ms between requests

setUp(scn.injectOpen(atOnceUsers(1)))
  .disablePauses() // disable the pauses for the simulation
Performator allows to define random pauses globally, per usecase or per request. It allows to turn off any defined pauses gobally.
HSRConfig.disablePauses(); // disable all pauses

PFRHttp.defaultPause(100, 500); // Wait 100 to 500 ms after each request to add some randomity

PFRHttp.create("020_MakeABreak", url+"/relax")
			.pause(500,1000)    // adjust pause for this request
Report Custom Properties
Adding custom properties to test reports like the tested stage (DEV, TEST etc…), the amount of test data records used, and such can help another person to get a clearer picture of what was tested. Especially when another test is executed a year later by another person, the two tests should be comparable.
K6 does not directly allow adding custom properties to reports, but there are workarounds, like adding a counter with tags:
import { Counter } from 'k6/metrics';
const myCounter = new Counter('my_counter');
myCounter.add(1, { env: 'staging', build: '1234' });Gatling, by its documentation, allows setting a run description on the command line, and that description should be added to the report. We were not able to produce this result when we tried the option:
-Dgatling.runDescription=DESCRIPTIONPerformator makes it possible to add custom report properties through the underlying statistic engine:
HSRConfig.addProperty("[Custom] Environment", ENV.toString());
HSRConfig.addProperty("[Custom] Testdata records", ""+DATA.size());
These properties will be available, for example, in HTML reports or in databases:

Report Test Settings
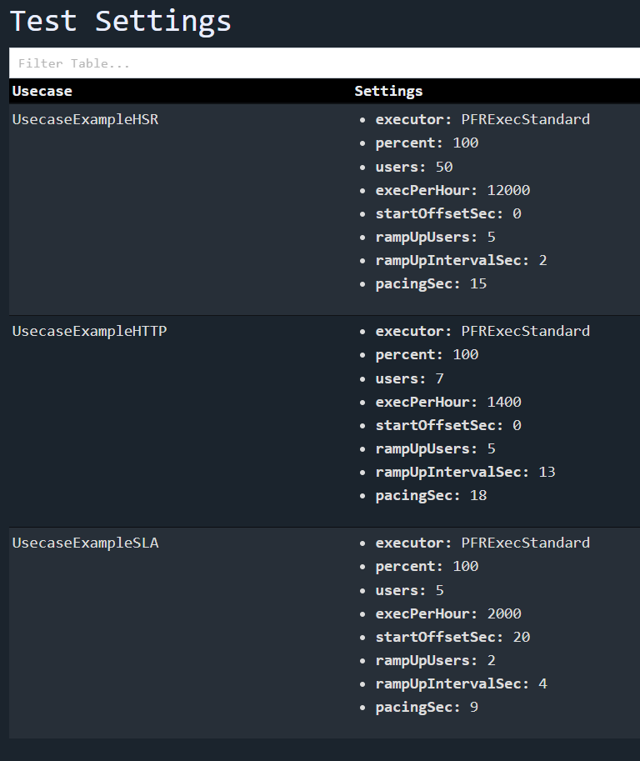
The test settings, like the number of users and target executions, should be included in the reports, as this will make it clear what was actually tested.
K6 does not include this information in their report, and it could only be manually be inserted with coding effort that makes the code less maintainable(similar to the workaround described in section “Report Custom Properties“).
Gatling does not report this information.
Performator automatically includes such information in HTML reports and stores it in databases:
Boxplot Analysis
Boxplot analysis allows you to see at a glance where your test is spending the most time and how the response times are distributed.
Neither K6 nor Gatling comes with a boxplot analysis in their reports.
Performator provides a boxplot analysis in its default HTML Report:

Filtering Metrics
When you have hundreds of metrics in your report, it can be tedious to gain a proper overview and find what you need.
K6 only provides raw data and summary reports, so you need to filter it yourself, e.g., in a Grafana dashboard.
Gatling HTML report does not have any filter capabilities.
Performator includes a Filter field in its HTML report that allows for quick filtering on the whole table row, including regex(if at least one “.*” is in the string):

Conclusions
From our viewpoint on the open-source market, Performator is, for most use cases, the best solution. It provides higher flexibility for scripting use cases and analyzing data. Gatling would rank second, while K6 provides the lowest amount of features and flexibility.
Pros for K6:
K6 is easily integrated when you have Grafana.
K6 reports detailed HTTP metrics for every stage of the request-response cycle.
K6 can have a rather small project size.
K6 can have an HTML report with a free extension (the report contains not much more info than the command line summary output)
K6 has a lower onboarding time as learning it is simpler.
Pros for Gatling:
Gatling is easier to use than K6 after initial training efforts and has a simpler code structure.
Gatling is well integrated and provides more features out of the box.
Gatling can be used for more use cases than K6.
Gatling is less cumbersome to use when creating complex use cases.
Gatling provides easy ways to retrieve test data from various file formats.
Gatling aggregates metrics with a report to a file and does not need any data store to get easy-to-analyze test results.
Gatling separates the metrics of successful and failed requests.
Gatling(with Gatlytron) can store aggregated metrics to various databases and file formats. It stores relevant and aggregated metrics. These can then be displayed in various monitoring views like Grafana or EMP.
Pros for Performator:
Performator is the easiest and most flexible of the three tools.
Performator is more integrated and provides the most features out of the box.
Performator can execute and measure anything that you can write in Java, including Database, MQ, and RMI calls.
Performator has the most extensive reporting of the three tools.
Performator lets you write your own custom reporters.
Performator is easy to use when creating complex use cases.
Performator provides a standardized way to handle test data that can be extended, supporting variable types.
Performator separates the metrics of successful and failed requests.
Performator is fully open source and free, built by Performance Engineering enthusiasts.
Recommendation
From our perspective, K6 can be used to test less critical systems that have a low amount of complexity, where a simple solution is sufficient. This might be useful for very simple API testing.
For more complex load testing use cases, where you want to have more control over what you measure and need to be more flexible with what you do, while you don’t want to store your test results in a database, Gatling is the better choice over K6.
If you’re looking for a free tool that offers extensive features, high flexibility, and unrestricted execution of Java code, Performator is an excellent choice.
If you have any questions regarding Performator, our team at Performetriks is happy to assist you. Contact us today!
Happy Performance Engineering!


Comments