

Using Performator to Load Test Database Calls

Have you ever needed a simple way to load test your database or check a lot of SQL statements with different test data to see how well your queries execute?
Performator version 1.2.3 comes with an easy-to-use interface that simplifies load testing using SQL queries.
Maven dependencies
You will need to define the dependencies that contain the JDBC driver for your database, for example, Postgres:
	<!-- https://mvnrepository.com/artifact/org.postgresql/postgresql -->
	<dependency>
		<groupId>org.postgresql</groupId>
		<artifactId>postgresql</artifactId>
		<version>#.#.#</version>
	</dependency>
There is no additional dependency required for Performator: the PFRDB feature is shipped with the following core dependency:
<!-- https://mvnrepository.com/artifact/com.performetriks/performator -->
<dependency>
    <groupId>com.performetriks</groupId>
    <artifactId>performator</artifactId>
    <version>#.#.#</version>
</dependency>
);
Connecting to a Database
Note: Make sure you have included the dependency that contains your JDBC driver. To connect to a database, use one of the PFRDB.init*() methods. It will return an interface that you can use to create your DB calls. Here is an example of how to connect to a PostGres Database:
	private static PFRDB db = PFRDB.initDBInterfacePostgres(
			  "localhost"
			, 5432
			, "postgres"	// dbname
			, "postgres"	// user
			, "postgres"	// pw
		);
Database Call Examples
With our PRFDB instance ready, we can now easily execute our SQL statement:
db.create() // no metricName = will use SQL as name
	.query("SELECT * from table")
	.close();
The following is an example that gives a custom metric name, which can be useful if the query is rather long. It also sets an SLA measurement and uses a prepared statement to set a variable:
int id = 1;
db.create("My Metric Name")
	.sla(HSRMetric.p90, Operator.LTE, 100) // p90 <= 500ms
	.query( "SELECT * FROM table WHERE id = ?", id)
	.close();
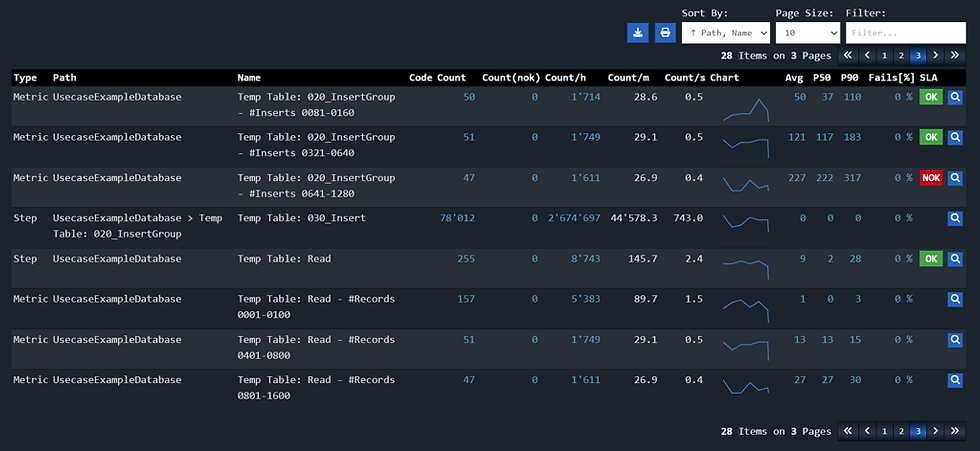
Above calls will send their measurements to the statistics engine, which will send them to the various reporters that come with Performator. Following is an example of a part of the HTML report that shows you the execution times as box plots:

Like other load testing tools, you will also get throughput statistics, SLA evaluations, fail rate, and other metrics that help you evaluate your system under test.
Conclusion
Performator provides a simple API to test your database statement and get insights into how well your database setup is handling your queries.
If you are looking to try Performator yourself, you can find everything you need on the official Performator Website or feel free to contact us at Performetriks. We are always ready to assist any concerns.
Happy Performance Engineering!



Comments